
Quick summary: Depending on the exact 10-year window and data source used, gold and the Nifty 50 have delivered remarkably similar long-term returns in India, with gold pulling narrowly ahead in most recent calculations. According to a FundsIndia report, gold surged at a CAGR of 16.9% over the last ten years, while the Nifty 50 delivered 13.7% over the same period. Other data sets, using slightly different start and end dates, show gold at 10-13.5% and Nifty at 11-12%. The two assets have essentially been neck and neck for a decade, which is itself a remarkable finding given that equities are supposed to be the long-run wealth compounder and gold is supposed to be the defensive asset. This guide breaks down exactly what happened, year by year, and why the comparison is closer than most investors assume.
What Do the Numbers Actually Show for Gold vs Nifty Over 10 Years?
Different data providers using different calculation windows arrive at somewhat different numbers, and it is worth being transparent about this range rather than picking one figure and presenting it as definitive.
| Source | Gold 10-Year CAGR | Nifty 50 10-Year CAGR | Data Period |
| FundsIndia (via Outlook Money) | 16.9% | 13.7% | Trailing 10 years to late 2025 |
| GoldAndIPO.com | ~15% | ~12% | 2015-2026 |
| CAGR Calculator (using Oct 2014-Oct 2024) | 11.07% | 11.6% | Oct 2014-Oct 2024 |
| Grip Invest | 12.16% (as of July 2025) | 11.2% (as of Aug 2025) | Trailing 10 years to mid-2025 |
| Bajaj AMC (NSE data) | 11-14% (range) | ~12.5% (20-year figure cited) | Various |
The takeaway from this range: gold has been at least competitive with, and in most recent calculations slightly ahead of, the Nifty 50 over the past decade. This has surprised many financial planners and investors, because the standard wisdom is that equities should meaningfully outperform gold over long horizons due to corporate earnings growth and compounding. That standard wisdom held true for most of India’s post-liberalisation history. The last 10 years have been an exception.
Why Has Gold Kept Pace With or Beaten the Nifty 50?
Three specific factors explain this unusual decade for gold, and understanding them helps you judge whether this pattern is likely to continue.
Rupee depreciation:
The rupee has weakened from approximately ₹63 per dollar in 2015 to approximately ₹85 per dollar in 2026. Since gold is priced in dollars globally, this currency depreciation adds roughly 25 to 30% to the INR price of gold over this period, regardless of what happens to the international dollar price of gold. This effect does not apply to the Nifty 50, which is a rupee-denominated index of rupee-earning Indian companies.
Central bank buying:
Global central banks, including the Reserve Bank of India, have been accumulating gold at record levels through 2022, 2023, 2024, and 2025, partly to diversify away from US dollar reserves amid geopolitical tension. This sustained institutional demand has provided a strong price floor and consistent upward pressure that retail investors do not typically anticipate.
Geopolitical and macro uncertainty:
The past decade included the COVID-19 pandemic, the Russia-Ukraine war, escalating US-China trade tension, and Middle East conflicts. Each of these episodes drove safe-haven buying into gold. In just the past one year alone (to late 2025), gold’s CAGR grew by approximately 54.9%, driven by heightened geopolitical tensions, economic uncertainty, and expectations of interest rate cuts by the US Federal Reserve.
Gold vs Nifty 50: What Happened Year by Year?
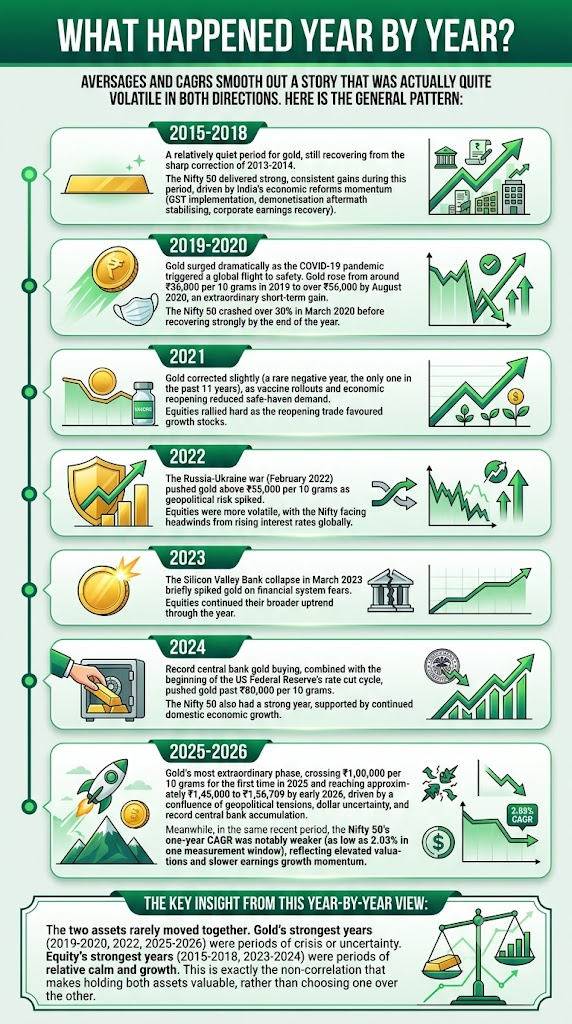
Averages and CAGRs smooth out a story that was actually quite volatile in both directions. Here is the general pattern:
2015-2018:
A relatively quiet period for gold, still recovering from the sharp correction of 2013-2014. The Nifty 50 delivered strong, consistent gains during this period, driven by India’s economic reforms momentum (GST implementation, demonetisation aftermath stabilising, corporate earnings recovery).
2019-2020:
Gold surged dramatically as the COVID-19 pandemic triggered a global flight to safety. Gold rose from around ₹36,000 per 10 grams in 2019 to over ₹56,000 by August 2020, an extraordinary short-term gain. The Nifty 50 crashed over 30% in March 2020 before recovering strongly by the end of the year.
2021:
Gold corrected slightly (a rare negative year, the only one in the past 11 years), as vaccine rollouts and economic reopening reduced safe-haven demand. Equities rallied hard as the reopening trade favoured growth stocks.
2022:
The Russia-Ukraine war (February 2022) pushed gold above ₹55,000 per 10 grams as geopolitical risk spiked. Equities were more volatile, with the Nifty facing headwinds from rising interest rates globally.
2023:
The Silicon Valley Bank collapse in March 2023 briefly spiked gold on financial system fears. Equities continued their broader uptrend through the year.
2024:
Record central bank gold buying, combined with the beginning of the US Federal Reserve’s rate cut cycle, pushed gold past ₹80,000 per 10 grams. The Nifty 50 also had a strong year, supported by continued domestic economic growth.
2025-2026:
Gold’s most extraordinary phase, crossing ₹1,00,000 per 10 grams for the first time in 2025 and reaching approximately ₹1,45,000 to ₹1,56,709 by early 2026, driven by a confluence of geopolitical tensions, dollar uncertainty, and record central bank accumulation. Meanwhile, in the same recent period, the Nifty 50’s one-year CAGR was notably weaker (as low as 2.03% in one measurement window), reflecting elevated valuations and slower earnings growth momentum.
The key insight from this year-by-year view:
The two assets rarely moved together. Gold’s strongest years (2019-2020, 2022, 2025-2026) were periods of crisis or uncertainty. Equity’s strongest years (2015-2018, 2023-2024) were periods of relative calm and growth. This is exactly the non-correlation that makes holding both assets valuable, rather than choosing one over the other.
Does Gold Ever Go Through Long Periods of No Return?
Yes, and this is a critical caveat that pure CAGR figures hide. Between 1980 and 2025, gold has witnessed several long periods in which the asset gave no returns after hitting record highs. In 1980, gold prices touched a record high amid high global inflation and geopolitical crisis. The metal then took 10 years to reclaim that peak. A similar phenomenon occurred between 1996 and 2002, when gold took seven years to hit its 1996 peak again, growing at a CAGR of 0% during that stretch. The same pattern repeated between 2012 and 2019, when gold spent years below its 2012 peak before finally breaking out again.
Equities also experience drawdowns, but historically shorter ones. The Nifty 50’s steepest historical decline was in 2008 (down 51.3% for the year), but the index has recovered from every major drawdown over time within a few years in most instances.
The practical lesson: if you had invested a lump sum in gold at its 1980 peak or its 2012 peak, you would have waited many years just to break even. Gold’s strong 10-year CAGR figures depend heavily on which exact 10-year window you pick. An investor who bought gold in 2012 and measured returns to 2019 would have seen a very different, much weaker outcome than an investor measuring 2015 to 2025.
How Does Risk Differ Between Gold and Nifty 50?
Returns alone do not capture the full picture; the probability and depth of losses matter too.
Over a one-month horizon, the likelihood of getting negative returns from gold is approximately 45%, compared to approximately 38% for equities. Over a three-month horizon, this narrows to approximately 38% for gold and 35% for equities. Over a three-year horizon, the chances of a negative return fall to approximately 14% for gold and just 6% for equities. Over a five-year horizon, the likelihood of a negative return falls to approximately 11% for gold and just 0.1% for equities.
This data reveals something important: equities are actually less likely to show a loss over long holding periods than gold is. Gold’s reputation as the “safe” asset applies mainly to its resilience during acute crises (when it often rises while equities fall), not to its statistical probability of positive returns over multi-year periods. Equities, held patiently, have historically been the more reliable long-term compounder in terms of consistency, even though gold has matched or exceeded their CAGR over the specific past decade.
What Does This Mean for a ₹10,000 Monthly SIP?
To make the comparison tangible, here is what a SIP investor would have experienced over 20 years (a longer, more stable measurement period than 10 years, since 10-year figures are more sensitive to the specific start and end dates chosen).
An SIP of ₹10,000 per month in the Nifty 50 at an assumed CAGR of 12% would have grown to approximately ₹99.91 lakh over 20 years. The 20-year CAGR for the Nifty 50 has been approximately 12.44% to 12.48% on a Total Return Index basis, according to NSE data as of early-to-mid 2026. Gold’s 20-year CAGR range, from various sources, sits between approximately 11% and 15.1%, depending on the exact data source and period.
Over 20 years specifically, the picture is more favourable to equities’ consistency: the Nifty 50’s 20-year CAGR has stayed within a fairly narrow range (roughly 12-13%) across different measurement periods, while gold’s 20-year CAGR has shown more variability (11% to 15%) depending on exactly when you start and stop measuring, because gold’s returns are much more concentrated in specific crisis-driven rally periods rather than being smoothly distributed.
Should You Choose Gold or Nifty 50 for Your Portfolio?
The most important finding from this data is not that one asset beat the other. It is that the two assets rarely peaked or troughed at the same time, and that is exactly what makes portfolio diversification valuable.
Consider the alternative framing: an investor holding 90% Nifty 50 and 10% gold over the past decade would have captured the Nifty’s steady, broad-based growth during calm years, while the 10% gold allocation cushioned the portfolio during 2019-2020, 2022, and 2025-2026, precisely the periods when equities were most stressed.
Gold and Nifty are like partners: one protects you when things go wrong, and the other makes your money grow when things go right. In a world as unpredictable as the past decade has been, having both in your portfolio has proven wiser than picking just one.
Practical allocation guidance:
- If your investment horizon is 15+ years and you can tolerate volatility, equities (via Nifty 50 index funds or diversified mutual funds) should remain your primary wealth-building engine, at 55-65% of your portfolio.
- Gold’s role is not to outperform equities every year; it is to reduce your portfolio’s overall volatility and protect you during the specific years when equities are weak.
- A 10 to 15% gold allocation, as covered in our gold allocation by age guide, captures this diversification benefit without diluting your long-term equity growth too much.
- Do not chase gold simply because its trailing 10-year number currently looks better than equity’s. Gold’s strong recent run followed a genuinely unusual confluence of crisis events. Relying on that pattern repeating indefinitely would be a mistake.
For a deeper look at how gold performs specifically during economic downturns, see our gold during recession guide. For how gold compares with other traditional Indian investments, see our gold vs fixed deposits guide and gold vs real estate guide.
How Are Gold and Nifty 50 Investments Taxed Differently?
Nifty 50 (via equity mutual funds or ETFs):
- Short-term capital gains (held under 12 months): taxed at 20%
- Long-term capital gains (held over 12 months): taxed at 12.5%, with the first ₹1.25 lakh of gains in a financial year exempt under Section 112A
Gold (ETF):
- Short-term capital gains (held under 12 months): taxed at your income slab rate
- Long-term capital gains (held over 12 months): taxed at 12.5% flat, with no exemption threshold and no indexation
Gold (physical):
- Short-term capital gains (held under 24 months): taxed at your income slab rate
- Long-term capital gains (held over 24 months): taxed at 12.5% flat, no indexation
Nifty 50 investments have a meaningful tax advantage: the ₹1.25 lakh annual LTCG exemption under Section 112A applies to equity gains, but gold has no such exemption. Every rupee of long-term gold gain is taxable at 12.5%. This is worth factoring into your after-tax return comparison, not just the headline CAGR.
Frequently Asked Questions
1. Has gold really outperformed the Nifty 50 over the last 10 years?
It depends on the exact measurement window. Several 2025-26 data sets, including a FundsIndia report, show gold’s 10-year CAGR (16.9%) exceeding the Nifty 50’s (13.7%). Other data sets using slightly different start and end dates show the two assets much closer, sometimes with Nifty slightly ahead. The honest answer is that they have been roughly comparable, with gold recently pulling ahead due to an extraordinary 2025-2026 rally.
2. Is gold a safer investment than the Nifty 50?
Gold is more resilient during acute crises (it often rises when equities fall sharply). But over 3-year and 5-year holding periods, the statistical probability of a loss is actually higher for gold (14% and 11% respectively) than for equities (6% and 0.1% respectively). Gold’s safety is about crisis behaviour, not overall return consistency.
3. Should I move my equity investments into gold given gold’s recent strong performance?
This would be a timing decision, which is generally risky. Gold’s extraordinary 2025-2026 rally followed a specific set of crisis conditions (geopolitical tension, central bank buying, dollar uncertainty) that may not persist. A better approach is maintaining a strategic allocation (10-15% gold, the rest in equity and other assets) and rebalancing periodically, rather than chasing whichever asset performed best in the trailing period.
4. Why does gold’s 10-year CAGR vary so much between different sources?
Gold’s price path has been very uneven, with sharp rallies concentrated in specific crisis years (2019-2020, 2022, 2025-2026) rather than smooth, steady growth. This means the exact start and end date you choose for a “10-year” calculation can produce meaningfully different CAGR figures, since you might be capturing more or less of a rally period. Equity indices tend to show more stable CAGR figures across different measurement windows because their growth is more evenly distributed over time.
5. If I had invested ₹1 lakh in gold and ₹1 lakh in Nifty 50 ten years ago, what would each be worth today?
Based on the FundsIndia data point (gold 16.9% CAGR, Nifty 13.7% CAGR over the trailing 10 years), ₹1 lakh in gold would be worth approximately ₹4.76 lakh, while ₹1 lakh in the Nifty 50 would be worth approximately ₹3.62 lakh. Using the more conservative CAGR Calculator data set (gold 11.07%, Nifty 11.6%), the two would be nearly identical, around ₹2.86 lakh and ₹3 lakh respectively. The gap between these two illustrative outcomes shows how sensitive this comparison is to the exact data source and period used.
6. Does this 10-year comparison mean gold is now a better long-term investment than equity?
Not necessarily. A single decade, however remarkable, does not overturn decades of financial theory and historical data showing that equities are the primary long-run wealth compounder, driven by real economic growth and compounding corporate earnings. Gold does not generate earnings; its price appreciation depends on external factors like currency movements, central bank policy, and crisis sentiment. Most financial planners continue to recommend equity as the core growth engine of a portfolio, with gold as a diversifying, risk-reducing allocation alongside it.
Key Takeaways
- Gold and the Nifty 50 have delivered broadly comparable returns over the past 10 years, with gold slightly ahead in most recent 2025-26 calculations: approximately 12-17% CAGR for gold versus approximately 11-14% CAGR for the Nifty 50, depending on the exact data source and measurement window.
- Gold’s outperformance is driven by three factors: rupee depreciation (adding 25-30% to INR gold prices over the decade), record central bank buying, and repeated geopolitical and macro crises (COVID-19, Russia-Ukraine war, US-China trade tension).
- The two assets rarely peaked together. Gold’s strongest years were crisis years (2019-2020, 2022, 2025-2026); equity’s strongest years were calmer growth years (2015-2018, 2023-2024). This non-correlation is the real value of holding both.
- Gold goes through long dry spells: 10 years (1980-1990), 7 years (1996-2002), and again 2012-2019, with essentially zero returns during these stretches. Equities have historically recovered from drawdowns faster.
- Equities show lower probability of loss over 3-5 year horizons (6% and 0.1% respectively) than gold (14% and 11% respectively), despite gold’s reputation as the “safer” asset.
- Tax treatment favours equity: Nifty 50 investments get a ₹1.25 lakh annual LTCG exemption under Section 112A; gold has no such exemption and is taxed at 12.5% on every rupee of long-term gain.
- The right approach is not choosing gold or Nifty 50, but holding both in a proportion suited to your age and risk tolerance, letting equity drive long-term growth and gold cushion the portfolio during crises.
Sources: FundsIndia Research, as reported by Outlook Money: Gold Outperforms Equities Over Near-Term and Long-Term, November 2025; Jainam: Gold vs Nifty 10-Year Returns Compared, May 2026; Bajaj AMC: Nifty 50 Historical Returns, NSE Nifty 50 Whitepaper data, May 2026; Grip Invest: Gold vs Nifty 50, Which Investment is Better?, August 2025; GoldAndIPO.com: Gold Price History India, April 2026.
This article is for general financial education only and does not constitute investment advice. Past performance does not guarantee future returns. Consult a SEBI-registered investment advisor before making portfolio decisions.