

Quick summary: Gold ETF expense ratios in India currently range from roughly 0.15% to 0.80% per year, and this single number, deducted continuously from the fund’s NAV, is one of the most reliable predictors of your long-term, after-cost return. This article compiles a comprehensive, single-reference list of expense ratios across the major Gold ETFs available in India in 2026, alongside their approximate AUM, so you can compare funds side by side without digging through a dozen separate factsheets.
Gold ETF Expense Ratio Comparison Table
The table below compiles expense ratio and AUM data for the major Gold ETFs available on NSE and BSE, drawn from multiple 2026 fund data sources and AMC factsheets. Expense ratios for mutual fund schemes change periodically (AMCs typically review and adjust them a few times a year), so treat the figures below as a current, directionally reliable snapshot rather than a permanently fixed number, and always confirm the live figure on the specific AMC’s website or the fund’s factsheet before investing.
| Gold ETF | Approx. Expense Ratio | Approx. AUM (₹ crore) | Notes |
| Zerodha Gold ETF | ~0.15-0.20% | Smaller, growing | Frequently cited among the lowest-cost options in the category |
| UTI Gold ETF | ~0.20-0.35% | Mid-to-large | Also frequently cited for low tracking error |
| ICICI Prudential Gold ETF | ~0.50% | ~34,900-48,900+ | One of the largest funds by AUM; consistently competitive on cost |
| Kotak Gold ETF | ~0.55-0.59% | ~11,200-16,700 | Large, well-established fund |
| HDFC Gold ETF | ~0.55% | ~13,600+ | Large, well-established fund |
| Axis Gold ETF | ~0.50-0.65% | Mid-sized | Competitive with the ICICI/Kotak/HDFC cluster |
| Aditya Birla Sun Life Gold ETF | ~0.50-0.65% | Mid-sized | Competitive with the ICICI/Kotak/HDFC cluster |
| Invesco India Gold ETF | ~0.55-0.65% | Smaller-to-mid | Included in most academic and comparative studies of the category |
| SBI Gold ETF | ~0.70% | ~15,300-21,500 | Large fund, strong trading volume |
| Quantum Gold Fund | ~0.75% (historically among the lower end for its structure) | Smaller | Long-running fund, frequently cited in comparative studies |
| Nippon India ETF Gold BeES | ~0.80% | ~34,950-48,950+ | India’s original and most liquid Gold ETF; highest AUM and trading volume in the category |
A few important notes on reading this table:
AUM ranges reflect different reporting dates across 2025-2026 sources.
Gold’s price rally through this period means AUM figures shift substantially month to month even without new inflows, simply because the underlying gold holdings appreciated in value. Treat these as approximate scale indicators (small, mid, large) rather than precise current figures.
Expense ratio is not the only cost that matters.
As covered in our companion articles on how Gold ETFs track gold prices and tracking error in Gold ETFs, a fund’s actual tracking difference and tracking error, along with its trading liquidity (bid-ask spread), together determine your real, all-in cost of ownership, not the expense ratio in isolation.
Notice the general pattern:
The largest, most liquid, longest-running funds (Nippon India ETF Gold BeES, SBI Gold ETF) tend to sit at the higher end of the expense ratio range, while some newer or smaller entrants (Zerodha Gold ETF) and a few mid-sized established names (ICICI Prudential, UTI) tend to sit at the lower end. This is not a universal rule, but it is a reasonably consistent pattern across current data.
Why Do Expense Ratios Differ Across Gold ETFs at All?
Since every physically backed Gold ETF holds essentially the same underlying asset (99.5% purity gold bullion), the expense ratio differences are driven almost entirely by the fund’s own operating costs and business model, not by any difference in what they hold.
Fund size and operational scale.
Larger funds can sometimes achieve better economies of scale in custody, auditing, and administrative costs, though this does not always translate into a visibly lower expense ratio, since fund houses also set pricing based on competitive positioning and their broader product strategy.
Distribution and marketing costs.
Funds with larger distributor networks and more active marketing may build these costs into a higher expense ratio, compared to a more purely digital-first, low-cost positioned fund.
Fund house pricing strategy.
Some AMCs deliberately price certain flagship products, often their oldest or most prominent fund in a category, at a specific level to compete on brand recognition and liquidity rather than pure cost, while newer entrants sometimes use a lower expense ratio specifically as a market-entry strategy to attract cost-conscious investors.
Custody and insurance costs for the physical gold.
While broadly similar across funds given SEBI’s standardised purity and custody requirements, minor differences in the specific custodian arrangements and insurance costs can contribute marginally to overall fund expenses.
What Does a 0.30 Percentage Point Expense Ratio Difference Actually Cost You?
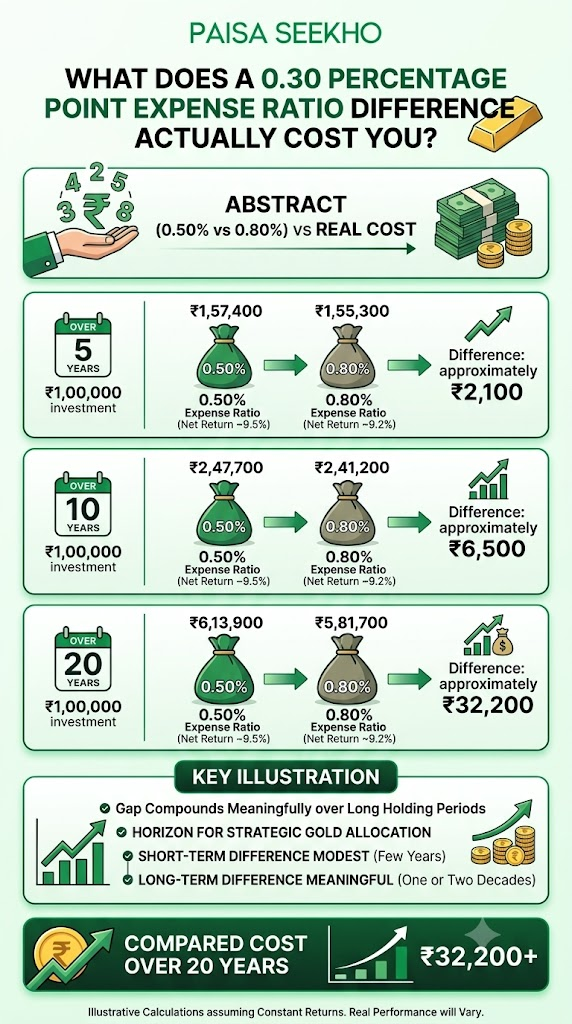
A single number like “0.50% vs 0.80%” can feel abstract. Here is what that gap actually means in rupee terms over different holding periods, assuming an illustrative 10% average annual gold return before costs, since your actual experience will vary with real gold price performance.
Over 5 years, on a ₹1,00,000 investment:
- At 0.50% expense ratio (net return approximately 9.5%): grows to approximately ₹1,57,400
- At 0.80% expense ratio (net return approximately 9.2%): grows to approximately ₹1,55,300
- Difference: approximately ₹2,100
Over 10 years, on a ₹1,00,000 investment:
- At 0.50% expense ratio: grows to approximately ₹2,47,700
- At 0.80% expense ratio: grows to approximately ₹2,41,200
- Difference: approximately ₹6,500
Over 20 years, on a ₹1,00,000 investment:
- At 0.50% expense ratio: grows to approximately ₹6,13,900
- At 0.80% expense ratio: grows to approximately ₹5,81,700
- Difference: approximately ₹32,200
What this illustrates: the gap between a 0.50% and a 0.80% expense ratio, seemingly small on paper, compounds meaningfully over a genuinely long holding period, which is exactly the horizon most people should be thinking about for a strategic gold allocation, as covered in our gold allocation by age guide. Over shorter holding periods (a few years), the difference is real but modest; over one or two decades, it becomes a meaningfully large sum in absolute rupee terms.
These are simplified, illustrative calculations assuming a constant return rate for demonstration purposes; actual gold returns vary year to year and the compounding effect of expense ratio differences will vary accordingly.
Should You Choose the Lowest Expense Ratio Fund Automatically?
Not necessarily, and this is worth stating clearly given how tempting it is to simply sort a comparison table by the lowest number and pick the winner.
Liquidity matters alongside cost.
A fund with a slightly lower expense ratio but significantly lower trading volume can expose you to a wider bid-ask spread when you actually buy or sell, an additional real-world cost that does not show up in the published expense ratio figure at all. If two funds differ by only 0.05 to 0.10 percentage points in expense ratio but one has dramatically higher daily trading volume, the more liquid fund may still be the more cost-effective choice overall, once you account for the spread you pay on entry and exit.
Tracking error and tracking difference matter just as much as the headline fee.
As covered in our dedicated article on this, a fund’s actual historical tracking performance, not just its stated expense ratio, determines how faithfully your investment mirrors gold prices. Two funds with identical expense ratios can show meaningfully different tracking error, driven by cash buffer management and execution efficiency.
For a Gold Mutual Fund (Fund of Funds), rather than a direct Gold ETF, expect a meaningfully higher total cost.
If you do not have a demat account and are instead investing through a Gold FoF (which itself invests in an underlying Gold ETF), your total cost typically stacks the FoF’s own expense ratio on top of the underlying ETF’s expense ratio. This structure is convenient for SIP investors without a demat account, but the total cost of ownership is meaningfully higher than a direct Gold ETF purchase, sometimes reaching a combined 0.80% to 1% or more, depending on the specific FoF and underlying ETF combination.
Your specific investment approach matters.
For a lump sum investment, prioritising a highly liquid fund even at a slightly higher expense ratio is often the more sensible trade-off, since execution quality on a large single transaction matters more. For a long-term, buy-and-hold SIP through a Gold FoF, liquidity of the underlying ETF matters comparatively less, since you are not actively trading in and out.
Frequently Asked Questions
1. What is the lowest expense ratio Gold ETF currently available in India?
Among widely tracked funds, Zerodha Gold ETF and UTI Gold ETF are frequently cited among the lower-cost options in the category as of current 2026 data, generally in the 0.15% to 0.35% range. Always verify the current figure directly on the fund’s factsheet, since expense ratios are reviewed and can change periodically.
2. Why does Nippon India ETF Gold BeES have a higher expense ratio despite being the largest fund?
Fund size (AUM) does not automatically translate into the lowest expense ratio; pricing also reflects the fund house’s positioning, its distribution model, and how long the fund has been established. Nippon India ETF Gold BeES, being India’s original and most liquid Gold ETF, is often chosen by traders and large investors specifically for its superior liquidity and execution quality, which can be worth the marginally higher expense ratio for those particular use cases.
3. Does a lower expense ratio always mean better overall returns?
Not automatically. Expense ratio is one component of your total cost, but tracking error, tracking difference, and the bid-ask spread you pay on actual trades also affect your real, realised return. A fund with a marginally higher expense ratio but meaningfully better liquidity and tighter tracking can sometimes deliver a comparable or even better net outcome than a fund that only wins on the headline expense ratio number.
4. How often do Gold ETF expense ratios change?
AMCs review and can adjust expense ratios periodically, sometimes a few times within a year, in response to AUM growth, competitive positioning, and regulatory expense ratio ceiling changes set by SEBI for different fund size slabs. This is why any static comparison table, including this one, should be treated as a snapshot rather than a permanently fixed reference; always check the current figure on the fund’s factsheet before investing.
5. Is the expense ratio different for a Gold ETF versus a Gold Mutual Fund (FoF) from the same fund house?
Yes, typically higher for the FoF structure. A Gold Mutual Fund (Fund of Funds) invests in an underlying Gold ETF and layers its own additional expense ratio on top, since it is providing the additional convenience of no-demat-account, SIP-friendly investing. The combined effective cost of a Gold FoF is usually meaningfully higher than investing directly in the underlying Gold ETF, if you have a demat account and are comfortable managing the direct purchase yourself.
6. Should I switch from a higher expense ratio Gold ETF to a lower one?
Consider the tax cost of the switch itself before deciding. Selling an existing Gold ETF holding triggers a capital gains tax event, 12.5% LTCG if held over 12 months, or your income slab rate if held for less time, as covered in our gold portfolio rebalancing guide. A small, ongoing expense ratio saving needs to be weighed against this one-time tax cost of switching; for a modest difference (0.05 to 0.15 percentage points), it is often more sensible to direct future new investments to the lower-cost fund rather than selling your existing holding purely to chase a marginally better expense ratio.
Key Takeaways
- Gold ETF expense ratios in India currently range from approximately 0.15% to 0.80% per year, depending on the fund.
- Among the lower-cost options frequently cited in current data are Zerodha Gold ETF and UTI Gold ETF, generally in the 0.15% to 0.35% range.
- ICICI Prudential Gold ETF, Kotak Gold ETF, HDFC Gold ETF, Axis Gold ETF, and Aditya Birla Sun Life Gold ETF typically cluster in a middle band of roughly 0.50% to 0.65%.
- SBI Gold ETF (~0.70%) and Nippon India ETF Gold BeES (~0.80%) are generally at the higher end of the expense ratio range among major funds, though Nippon compensates with by far the highest liquidity and trading volume in the category.
- A 0.30 percentage point expense ratio difference compounds to a meaningful rupee gap over long holding periods: modest over 5 years, but substantial (tens of thousands of rupees on a ₹1 lakh investment) over 15 to 20 years.
- Do not choose purely on the lowest expense ratio number. Liquidity (bid-ask spread), tracking error, and fund structure (direct Gold ETF versus Gold FoF, which stacks an additional layer of fees) all affect your real, all-in cost of ownership.
- Expense ratios change periodically; always verify the current figure on the specific fund’s factsheet or AMC website before making a final investment decision, rather than relying solely on any static comparison table.
Sources: Lakshmishree: Best Gold ETFs in India 2026, Returns, Expense Ratio and Top Picks, February 2026; TMGM: Top 5 Best Gold ETF in India for 2026, May 2026; Angel One: Best Gold ETFs in India for January 2026; FinPlann: Best Gold ETFs 2026, Top Picks with Lowest Expense Ratios, April 2026; Finology: Best Gold ETF in India 2026, Top Funds, Returns and Tax Guide, April 2026.
This article is for general financial education only and does not constitute investment advice. Expense ratios, AUM, and fund rankings change over time; always verify current figures from the fund’s official factsheet before investing. Past performance does not guarantee future returns. Consult a SEBI-registered investment advisor for personalised guidance.