

Quick summary: For most of the past two decades, US equities, particularly the Nasdaq 100, have decisively outperformed gold for Indian investors on a rupee-adjusted basis. NASDAQ TRI has delivered a CAGR of approximately 19.5% to 23.9% across 10, 15, and 20-year measurement windows, well ahead of gold’s roughly 13% to 15% CAGR over comparable periods. But 2025 disrupted this pattern dramatically: gold surged over 66% for the year while the S&P 500 delivered a still-respectable 17.78%, the kind of year that makes investors question long-held assumptions. Both assets deserve a place in a well-constructed Indian portfolio, but they serve genuinely different purposes, and understanding those differences matters more than chasing whichever one had the better headline year.
How Have Gold and US Stocks Actually Compared Over the Long Term?
Long-term historical data consistently shows US equities, and Nasdaq-heavy exposure in particular, outperforming gold by a wide margin for Indian investors.
According to CAGR data measured across multiple time horizons, NASDAQ TRI ranks first across the 10-year, 15-year, and 20-year frames, with CAGRs of 23.4%, 23.9%, and 19.5% respectively. The broader S&P 500 TRI also outperforms across most of these frames. Separately, looking at 2007 to 2025 specifically, the NASDAQ-100 achieved a 16.0% CAGR with a cumulative return of 1,342%, while the S&P 500 delivered an 11.1% CAGR with a cumulative return of 560%. A $10,000 investment made ten years ago would be worth approximately $50,000 to $60,000 in the NASDAQ-100, compared to $30,000 to $35,000 in the S&P 500.
Gold’s own long-term rupee CAGR, by comparison and as covered in our earlier articles in this series, has generally sat in the 13% to 15% range over similar 10 to 20-year windows, with wide variability depending on the exact start and end dates chosen, since gold’s returns are concentrated in specific crisis-driven rally periods rather than smoothly distributed. Even the strongest historical gold data sets place it meaningfully behind Nasdaq-level US equity exposure over most multi-decade stretches.
Why Did 2025 Look So Different?
2025 was a genuine outlier year that briefly flipped the standard long-term pattern on its head. In 2025, the S&P 500 delivered a total return of 17.78%, a strong year by any normal historical standard, while gold finished the year up 66.22%, according to data compiled by the New York University Stern School of Business.
This was driven by a specific confluence of factors covered in detail in our earlier articles on gold as an inflation hedge and gold during recession: record central bank gold accumulation, heightened geopolitical tension, dollar uncertainty, and expectations of US Federal Reserve rate cuts.
Despite gold’s historic rally, the S&P 500 reached a new all-time high at the start of June 2026, a reminder that short-term results, however dramatic, often tell only part of the story. A single exceptional year for gold does not overturn multiple decades of data showing equities as the stronger long-run compounder. The gold ratio, calculated by dividing the gold price in dollars by the S&P 500 index value, provides a useful lens on this: as of January 2026, this ratio sits at approximately 0.44, down from its March 2020 pandemic-panic peak of nearly 0.65, indicating that despite gold’s strong recent run, equities have still been gaining relative ground over the medium term when measured this way.
Does Rupee Depreciation Make US Stocks Even More Attractive for Indian Investors?
Yes, and this is one of the most important structural factors in this comparison, since it applies specifically to Indian investors and not to US-based ones.
The rupee has depreciated against the dollar consistently over the decades. When Nifty 50’s INR CAGR of 10 to 11% is adjusted for this depreciation, the effective dollar-denominated return falls considerably, while NASDAQ’s returns, already measured in USD, need no such adjustment for a US-based comparison. But flip this around for an Indian investor holding rupee-denominated wealth: the same rupee depreciation that erodes the dollar value of Indian equity returns for foreign investors actually adds to the rupee value of any US dollar-denominated asset held by an Indian investor, exactly the same currency mechanism that benefits gold, which is also dollar-priced globally, as covered in our gold vs Nifty 50 comparison.
For Indian investors specifically, rupee depreciation adds substantial returns on top of the underlying US index performance itself. This means both gold and US equities benefit from the same currency tailwind relative to purely rupee-denominated Indian assets, which is an important reason why both deserve consideration as a genuine diversification layer beyond domestic-only portfolios.
How Do Gold and US Stocks Differ in Risk and Volatility?
Both assets carry real volatility, but the character of that volatility differs meaningfully.
Gold’s volatility typically ranges between 15% and 20% annually, with sharp spikes during crisis events. The S&P 500’s volatility is generally in the 14% to 18% range annually, though it can exceed 30% during severe market corrections. The correlation between the two assets is historically low to negative during periods of market stress, which is precisely what makes them complementary rather than substitutable holdings in a portfolio.
The drawdown character also differs by asset and by index. During the dot-com crash from 2000 to 2002, the NASDAQ-100 lost a punishing 82.9%, while the S&P 500 dropped 49.1%; the NASDAQ took roughly 15 years to fully recover from that specific drawdown. During the 2008 financial crisis, the NASDAQ-100 actually outperformed the S&P 500 (falling 53.5% versus 56.8%) because it excluded the financial sector at the epicentre of that particular meltdown. Gold, over the same 2008 period, rose roughly 16% while both equity indices fell sharply, exactly the kind of crisis behaviour that makes gold valuable as a portfolio stabiliser even when its long-run CAGR trails high-growth equity indices like the Nasdaq.
The practical lesson:
Gold often experiences lower drawdowns during equity bear markets, serving as a hedge during turbulent periods, but during extended bull markets in stocks, gold frequently underperforms, creating a widening gap in relative returns the longer the bull market runs. Neither asset is “safer” in an absolute sense; they are safer in different, specific circumstances.
How Do Gold and US Stocks Generate Returns Differently?
This distinction matters more than headline CAGR figures alone suggest, since it affects how the two assets compound over multi-decade holding periods.
US equities, particularly S&P 500 constituents, generate returns through a combination of price appreciation, dividend yield, and share buybacks. Current dividend yields on the S&P 500 hover around 1.3% to 1.5% as of early 2026, and these dividends compound over decades, contributing meaningfully to total returns beyond price appreciation alone. Share buybacks have also become an increasingly dominant mechanism for returning value to shareholders: S&P 500 companies repurchased a record $1.1 trillion in 2025 alone. The Nasdaq-100 skews even further toward this pattern, since only 58 of its 101 constituent stocks pay any dividend at all, with buybacks doing much of the shareholder-return work instead.
Gold, by contrast, produces zero income of any kind. It generates no yields, dividends, or interest under standard investment vehicles like Gold ETFs. Investors profit solely from price appreciation, making gold a purely capital-gains-driven asset. This fundamental difference matters over multi-decade horizons, since dividend reinvestment is itself a compounding mechanism that gold structurally lacks, and it is part of why equities have historically outpaced gold over sufficiently long holding periods despite gold’s occasional standout years.
How Are Gold and US Stocks Taxed Differently for Indian Investors?
This is a genuinely important practical difference that is easy to overlook when comparing headline return figures alone.
Gold (held via Indian Gold ETFs):
Long-term capital gains, after holding for over 12 months, are taxed at a flat 12.5%, with no indexation benefit, under the Finance Act 2024 rules covered throughout our earlier gold articles in this series.
US stocks held via Indian international mutual fund Fund of Funds (FoFs):
As covered in detail in our guide to investing in international mutual funds, these are taxed the same way as any other non-equity-oriented fund from FY 2025-26 onward: 12.5% LTCG after 24 months, slab rate if sold within 24 months, with no ₹1.25 lakh exemption available (that exemption applies only to domestic equity-oriented funds under Section 112A).
US stocks held directly via the LRS route
This can be done through platforms like INDmoney, Vested Finance, or Stockal, remitting funds abroad under the Liberalised Remittance Scheme. These are treated as foreign assets and foreign capital gains, requiring disclosure in Schedule FA of your Indian ITR. Gains are taxed based on the specific holding period and asset classification rules for foreign securities, and a Tax Collected at Source (TCS) of 0.5% applies on LRS remittances above ₹7 lakh in a financial year (adjustable against your final tax liability). If the US also withholds tax on dividends (a standard 25% or 30% withholding on US-source dividends for non-resident investors, depending on any applicable tax treaty), Indian investors can claim a Foreign Tax Credit for that withheld amount, a process covered in detail in our Form 67 guide.
The tax treatment for both gold and US-stock FoFs converged significantly after the Finance Act 2024 changes, both now sitting at 12.5% LTCG, though with different holding period thresholds (12 months for gold ETFs, 24 months for international FoFs) and different exemption structures (gold has none; domestic equity has the ₹1.25 lakh exemption that international funds do not share).
How Do Indian Investors Actually Access US Stocks, and Does the $7 Billion Cap Matter?
This is a critical practical constraint that pure return comparisons tend to ignore entirely, and it is unique to the current Indian regulatory environment.
As covered in detail in our international mutual funds guide, Indian mutual funds investing overseas are subject to a SEBI-mandated industry-wide cap of $7 billion (plus a separate $1 billion sub-limit for overseas ETFs) on total overseas investment. As of mid-2026, this limit has been repeatedly bumped against, and multiple major fund houses have suspended or restricted fresh subscriptions into their international schemes, including Nasdaq 100 and S&P 500 focused funds, at various points during the year.
This means access to US equity exposure through the Indian mutual fund route is genuinely uncertain and can change week to week, in a way that gold investing (through Gold ETFs, which face no such cap) simply does not. Gold ETFs can be bought without any availability constraint at essentially any time; US-focused Indian mutual funds cannot always make that same guarantee right now.
The alternative route:
Direct investment in US stocks via the LRS route, remitting up to $250,000 per person per financial year abroad, bypasses the mutual fund cap entirely since the money leaves India directly rather than routing through a capped Indian fund structure. This has become an increasingly popular workaround among Indian investors specifically because of the domestic fund access constraints, though it comes with its own added complexity: foreign asset disclosure requirements, TCS on remittances, and the responsibility of managing a foreign brokerage account directly rather than through a professionally managed Indian fund.
Should You Choose Gold or US Stocks, or Both?
Academic research and real-world data consistently demonstrate that a portfolio containing both gold and equities delivers better risk-adjusted returns than either asset alone, precisely because of the low correlation between them. This general diversification principle applies just as much to the specific gold-versus-US-equities comparison as it does to the more commonly discussed gold-versus-domestic-equities comparison covered in our gold vs Nifty 50 article.
Even a 5% to 10% allocation to gold can meaningfully reduce overall portfolio volatility over multi-decade periods, without materially diluting the long-run growth contribution from equities, whether domestic or international.
A reasonable framework for an Indian investor considering both:
- Core domestic equity (Nifty 50, broad-based diversified funds): the primary long-term wealth engine for most Indian investors, aligned with rupee-denominated goals like a home purchase or children’s education in India.
- International equity exposure (US-focused funds or direct LRS investment, sized to your goals and comfort with the added complexity): 10% to 30% of your total equity allocation is a range commonly suggested by financial planners for currency diversification and access to sectors underrepresented in Indian markets, such as large-cap technology and AI infrastructure. Note the current access constraints from the SEBI cap when planning this allocation practically.
- Gold (via Gold ETFs, unconstrained by the mutual fund cap): 5% to 15% of your total investment portfolio, sized according to your age and life stage, as covered in our gold allocation by age guide, serving as portfolio insurance and a crisis and inflation hedge rather than a primary growth engine.
When rupee depreciation always favours US investments, and when it does not:
Rupee depreciation, historically 3% to 4% per year against the dollar, eats into your dollar-adjusted Indian equity returns but simultaneously boosts the attractiveness of owning US dollar-denominated assets, whether gold or US stocks, for Indian investors looking to preserve global purchasing power. If your major future expenses and financial goals are denominated in rupees (a house in India, children’s education domestically), overweighting India still makes structural sense. If significant future liabilities are in dollars (US-based higher education, an eventual move abroad, dollar-denominated lifestyle costs), both gold and US equity exposure become considerably more relevant to your specific planning.
Frequently Asked Questions
1. Has gold really outperformed US stocks over the last 10 years?
Not over the full 10-year period when measured by standard CAGR: NASDAQ TRI has delivered approximately 23.4% CAGR over 10 years, well ahead of gold’s roughly 13% to 15% CAGR over comparable windows. However, 2025 specifically was an exceptional year for gold (66.22% return) compared to a strong but more modest S&P 500 return (17.78%), which has understandably prompted many investors to revisit this comparison. A single standout year does not overturn the longer-term pattern.
2. Is it better to invest in Nasdaq 100 or gold for long-term wealth building?
Historically, Nasdaq 100 exposure has delivered significantly higher long-term CAGR than gold across every measured multi-decade horizon, though with meaningfully higher volatility and much more severe historical drawdowns (an 82.9% peak-to-trough decline during the 2000-2002 dot-com crash, for example). Gold’s role is fundamentally different: portfolio insurance and crisis protection rather than primary growth. Most financial planners suggest holding both, in different proportions suited to your risk tolerance and goals, rather than choosing one over the other.
3. Does rupee depreciation benefit gold and US stocks equally?
Broadly yes, since both are priced in or linked to US dollars globally, and rupee depreciation adds to the rupee-denominated value of both asset types for an Indian investor, independent of what happens to the underlying dollar price of either asset. The magnitude of this currency effect has been roughly similar for both over the past decade, adding an estimated 3% to 4% per year to rupee returns on top of the underlying dollar-denominated performance.
4. Can I actually invest in Nasdaq 100 funds right now, given the SEBI cap issue?
It depends on the specific fund and the current state of the SEBI-mandated $7 billion overseas investment cap, which several major fund houses have bumped against at various points through 2025 and 2026, leading to temporary suspensions of fresh subscriptions in some schemes. Always check the specific fund’s current subscription status before investing. The direct LRS route (investing through a US brokerage platform) bypasses this cap entirely but comes with additional complexity around foreign asset disclosure and remittance TCS.
5. Which is taxed more favourably: gold or US stock funds, for an Indian investor?
Since the Finance Act 2024 changes, both are now taxed similarly at the headline rate: 12.5% LTCG. The key difference is the holding period threshold (12 months for Gold ETFs, 24 months for international equity FoFs) and the fact that gold has no annual exemption threshold at all, while domestic equity-oriented funds (though not international ones) benefit from a ₹1.25 lakh annual LTCG exemption under Section 112A that does not extend to either gold or international funds.
6. Should I sell my gold and put the money into US stocks given gold’s recent extraordinary rally?
This would be a market-timing decision, which is generally risky regardless of which asset you are moving out of or into. Gold’s 2025 rally followed a specific, unusual confluence of crisis-driven factors that may not persist indefinitely. A more disciplined approach is maintaining a standing strategic allocation to both asset classes, rebalancing periodically rather than reactively shifting the entire allocation based on whichever asset had the stronger trailing-year performance.
Key Takeaways
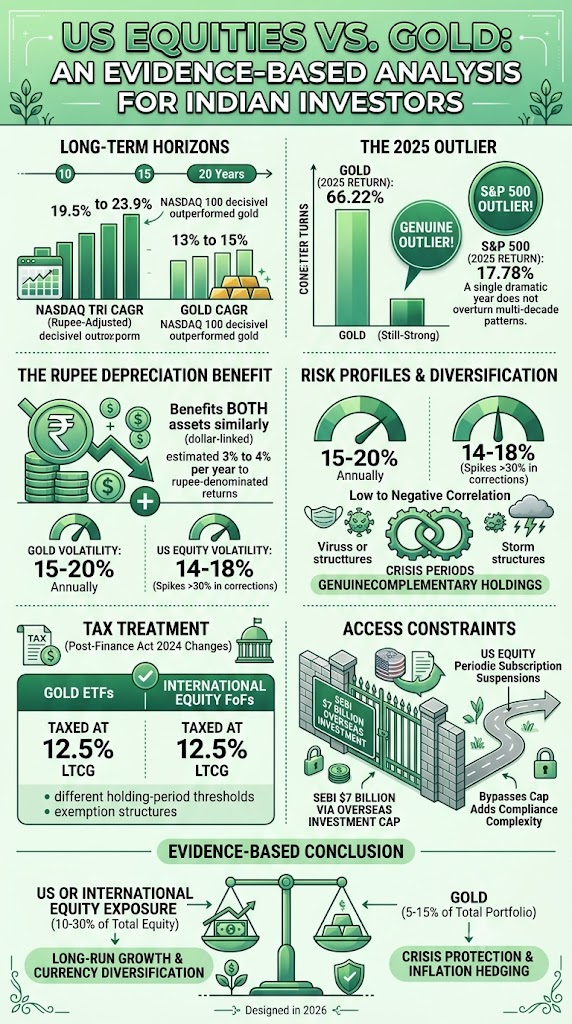
- Over 10, 15, and 20-year horizons, US equities, particularly the Nasdaq 100, have decisively outperformed gold for Indian investors on a rupee-adjusted basis, with NASDAQ TRI CAGRs of 19.5% to 23.9% against gold’s roughly 13% to 15% over comparable periods.
- 2025 was a genuine outlier: gold returned 66.22% for the year while the S&P 500 delivered a still-strong 17.78%, a reminder that any single year, however dramatic, does not overturn multi-decade historical patterns.
- Rupee depreciation benefits both assets similarly for Indian investors, since both gold and US equities are dollar-linked, adding an estimated 3% to 4% per year to rupee-denominated returns on top of underlying dollar performance.
- Risk profiles differ but are comparable in magnitude: gold’s volatility (15-20% annually) is broadly similar to US equity volatility (14-18%, though spiking above 30% in severe corrections), with low to negative correlation between the two during crisis periods, making them genuinely complementary holdings.
- Tax treatment has converged since the Finance Act 2024 changes: both gold ETFs and international equity FoFs are now taxed at 12.5% LTCG, though with different holding-period thresholds and exemption structures.
- Access to US equities via Indian mutual funds is currently constrained by the SEBI $7 billion overseas investment cap, which has led to periodic subscription suspensions; the direct LRS route bypasses this but adds compliance complexity.
- The evidence-based conclusion is not to choose between gold and US stocks, but to hold both in proportions suited to your goals: US or international equity exposure (10-30% of total equity allocation) for long-run growth and currency diversification, and gold (5-15% of total portfolio) for crisis protection and inflation hedging.
Sources: Finnovate: Indian Equity Returns vs Gold, What 20-Year Data Reveals, April 2026; VT Markets: Gold vs S&P 500, 2026 Performance Comparison and Investment Guide, January 2026; Monetary Metals: Gold vs S&P 500, Which Performs Better Historically?, June 2026; Winvesta: NASDAQ vs S&P 500, Which Index Should Indian Investors Choose?, February 2026; RITS Capital: Comparative Analysis of Indian and US Stock Markets in 2026, January 2026.
This article is for general financial education only and does not constitute investment advice. Past performance does not guarantee future returns. Foreign investments carry currency, regulatory, and geopolitical risks in addition to standard market risk. Consult a SEBI-registered investment advisor before making cross-border allocation decisions.