

Quick summary: Every Gold ETF fact sheet mentions “tracking error” as a headline metric, but most explanations stop at the definition without showing you the actual formula, the real numbers, or how to read them. This article is a numbers-focused companion to our broader explainer on how Gold ETFs track gold prices. Here, we go one level deeper: the precise calculation methodology, the crucial distinction between tracking error and tracking difference (two related but genuinely different metrics that get used interchangeably in casual conversation), real 2026 figures for major Indian Gold ETFs, and a step-by-step method to calculate it yourself from published NAV data.
What Is the Actual Formula for Tracking Error?
Tracking error is formally defined as the annualised standard deviation of the difference between a fund’s daily returns and its benchmark’s daily returns. This is a more precise definition than “the gap between the ETF and gold,” and the distinction matters because it changes what the number actually tells you.
Here is the calculation broken into steps:
- Step 1: For each trading day, calculate the fund’s daily return and the benchmark’s (domestic gold price’s) daily return separately.
- Step 2: Subtract the benchmark’s daily return from the fund’s daily return for each day. This gives you a daily “difference” series.
- Step 3: Calculate the standard deviation of this entire difference series over your chosen period (commonly one year of daily data).
- Step 4: Annualise this standard deviation, typically by multiplying by the square root of 252 (the approximate number of trading days in a year), to arrive at the final tracking error figure, usually expressed as a percentage.
What this formula actually measures:
Tracking error captures the volatility or consistency of the day-to-day gap between the fund and gold, not simply the average size of the gap. A fund could have a small average daily difference from gold but a large tracking error if that difference swings unpredictably from strongly positive on some days to strongly negative on others. Conversely, a fund with a slightly larger but very consistent daily difference (say, always underperforming gold by almost exactly 0.001% per day, purely from a small daily expense drag) would show a low tracking error despite a real, measurable cumulative cost over time.
This is precisely why tracking error and tracking difference are not the same thing, and conflating them is the single most common error people make when reading a Gold ETF fact sheet.
Tracking Error vs Tracking Difference: What Is the Actual Distinction?
Tracking difference is simply the difference between the annualised returns generated by the fund and its benchmark over a specific period. If gold returned 12% over a year and your ETF returned 11.6%, the tracking difference is -0.4 percentage points. This is a straightforward, intuitive number: it tells you exactly how much return you gave up (or, less commonly, gained) relative to holding the benchmark directly.
Tracking error, as defined above, is the annualised standard deviation of the daily return differences. It tells you how volatile or erratic that gap has been on a day-to-day basis, not the cumulative size of the gap.
A practical way to think about the difference: tracking difference is your report card grade at the end of the year; tracking error is how much your daily quiz scores bounced around to get you there. Two funds can arrive at an identical, respectable tracking difference over a year, while one did so with smooth, consistent daily tracking (low tracking error) and the other did so with wild day-to-day swings that happened to average out (high tracking error). For an investor who might need to buy or sell on any given day (not just at year-end), the fund with lower tracking error is the more reliable, more predictable holding on any specific date, even if the two funds’ full-year tracking difference numbers look similar.
Why both numbers matter together:
A consistently low tracking error with a small, expected tracking difference (roughly matching the fund’s expense ratio) is the signature of a well-run, faithfully replicating Gold ETF. A large or erratic tracking error, or a tracking difference that is unexpectedly large relative to the fund’s stated expense ratio, both deserve scrutiny.
Real 2026 Tracking Error Numbers: How Do Indian Gold ETFs Actually Compare?
Here is a comparison table compiling reported tracking error figures for several major Indian Gold ETFs, drawn from multiple 2026 fund data sources. Note that tracking error figures are reported by different data providers using somewhat different calculation windows and methodologies, so treat these as directionally indicative rather than perfectly interchangeable across sources, and always check the specific fund’s latest factsheet for the most current, methodology-consistent figure.
| Gold ETF | Approx. Tracking Error | Approx. Expense Ratio | AUM Scale |
| UTI Gold ETF | Among the lowest in the category (reported as low as 0.06% in some data sets) | Low to moderate | Mid-to-large |
| Nippon India ETF Gold BeES | Low (reported around 0.17% in one data set; ranked among top performers in others) | Around 0.25% | Very large, highest trading volume in category |
| Kotak Gold ETF | Low-moderate (reported around 0.19% in one data set) | Moderate | Large (AUM in the ₹13,000+ crore range as of mid-2026) |
| SBI Gold ETF | Low-moderate (reported around 0.20% in one data set) | Moderate | Large |
| HDFC Gold ETF | Low-moderate (reported around 0.22% in one data set) | Moderate | Large |
| ICICI Prudential Gold ETF | Moderate (reported around 0.25% in one data set) | Moderate | Very large (AUM over ₹22,000 crore), strong liquidity |
| Aditya Birla Sun Life Gold ETF | Among the lower figures reported in the category | Moderate | Mid-sized |
| Quantum Gold Fund | Competitive, frequently cited among better performers in academic studies | Typically among the lower expense ratios in the category | Smaller |
An important caveat on this table: tracking error figures change over time as market conditions, fund AUM, and now, following the 2026 SEBI valuation methodology shift covered in our companion article, the underlying NAV calculation basis itself, all evolve. A fund’s tracking error as reported in early 2026 (under the older LBMA-anchored valuation approach) is not necessarily directly comparable to figures reported later in the year under the new domestic spot price valuation regime. Always pull the current figure from the fund’s own factsheet or a live data aggregator (such as AMFI, Value Research, or the AMC’s own published documents) rather than relying on any static, dated comparison, including this one, as your final decision input.
What Does an Academic Study Actually Find About Long-Run Tracking Accuracy?
Beyond the day-to-day tracking error metric, it is worth looking at the bigger picture: over a full decade, how closely have Indian Gold ETFs, in aggregate, actually mirrored physical gold’s return?
A comparative empirical study examining ten major Indian Gold ETFs, including Invesco India Gold ETF, HDFC Gold ETF, Kotak Gold ETF, Axis Gold ETF, Nippon India ETF Gold BeES, SBI Gold ETF, ICICI Prudential Gold ETF, Quantum Gold Fund, UTI Gold ETF, and Aditya Birla Sun Life Gold ETF, found that over a 10-year period, these ETFs provided competitive returns ranging from 11.16% to 11.36%, while physical gold itself recorded 11.01% over the same period.
Notice what this means: on average, over this specific 10-year measurement window, the ETFs in this study slightly outperformed physical gold, not underperformed it. This is not a contradiction of the tracking error concept, since tracking error and outperformance or underperformance are about the volatility and direction of the year-to-year gap, not a guarantee that the gap is always negative. The study attributes this specific outperformance to a combination of efficient fund management, liquidity benefits, and, importantly, the fact that physical gold ownership carries costs (making charges, storage expenses) that a Gold ETF simply does not incur, so a Gold ETF can sometimes edge out the raw, unadjusted spot gold price figure typically used as the reference benchmark, even while the fund’s own internal expense ratio creates a small, separate drag relative to its actual target index.
The same broader research consistently found that ETFs with higher AUM and lower tracking errors, specifically citing Nippon India Gold BeES and HDFC Gold ETF as examples, tend to consistently outperform smaller, less liquid funds in the category. This reinforces a point also made in our companion article: fund size and liquidity are not just convenience factors; they correlate with tracking quality itself.
How Can You Calculate Gold ETF Tracking Error Yourself From Published Data?
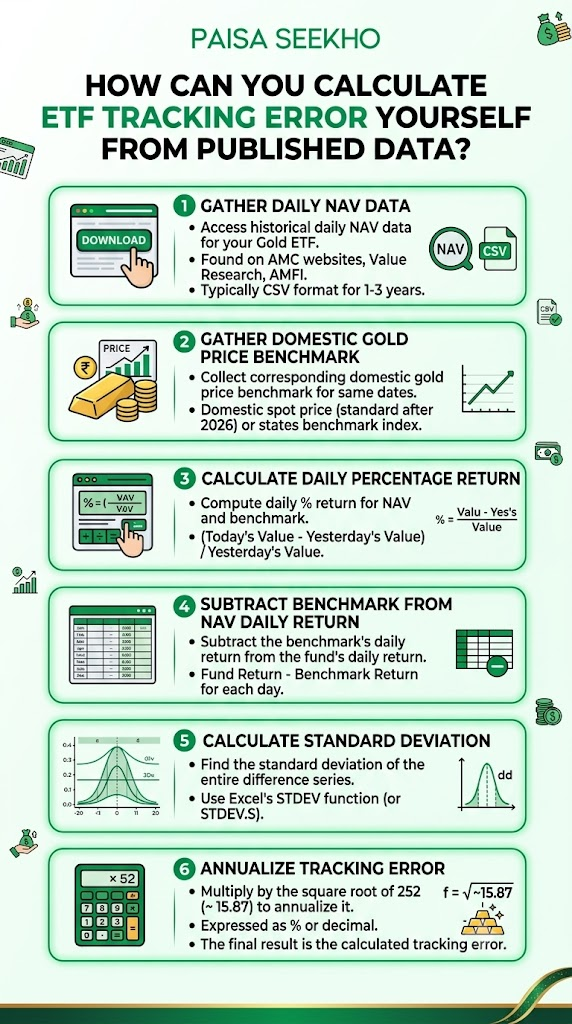
If you want to verify a specific fund’s tracking error rather than relying entirely on third-party reported figures (which, as noted, can vary by methodology and data source), here is a simplified, practical approach using data you can access yourself.
Step 1: Gather daily NAV data for your chosen Gold ETF.
Most AMC websites and platforms like Value Research or AMFI publish historical daily NAV data that you can download, typically as a CSV file, for at least the past one to three years.
Step 2: Gather the corresponding domestic gold price benchmark for the same dates.
This can be the domestic spot gold price (increasingly the standard reference following the 2026 SEBI methodology shift) or, for consistency with older data, the specific benchmark index the fund states it tracks in its Scheme Information Document.
Step 3: Calculate the daily percentage return for both the fund’s NAV and the benchmark.
You can do this using the standard formula: today’s value minus yesterday’s value, divided by yesterday’s value.
Step 4: Subtract the benchmark’s daily return from the fund’s daily return
Do this for each day, to get your daily difference series.
Step 5: Calculate the standard deviation of this entire difference series
You can do this using a spreadsheet’s STDEV function (or STDEV.S for a sample standard deviation, the more commonly used convention for this purpose).
Step 6: Multiply this standard deviation by the square root of 252
This would be approximately 15.87 to annualise it. This final number is your calculated tracking error, expressed as a percentage or decimal, depending on how your returns were formatted.
This is genuinely a spreadsheet-level exercise, not something requiring specialised software, and doing it once for a fund you are seriously considering can be a useful exercise in understanding exactly what the number represents, rather than simply trusting a single reported figure from one source.
What Should You Actually Do With This Information?
Tracking error and tracking difference are genuinely useful screening tools, but they should inform, not solely determine, your choice of Gold ETF. Combine this data with the practical considerations covered in our broader Gold ETF tracking guide: fund liquidity (trading volume and bid-ask spread), fund size (AUM), and your specific investment goal, whether long-term buy-and-hold allocation as covered in our gold allocation by age guide, or shorter-term tactical positioning.
A practical checklist when comparing funds:
- Check tracking error over at least two different time windows (say, 1-year and 3-year) to assess consistency, not just a single snapshot.
- Check whether the reported tracking difference roughly matches the fund’s stated expense ratio; a large, unexplained gap between the two is worth investigating further.
- Prefer funds with larger AUM and higher daily trading volume, both of which tend to correlate with more efficient, lower-error tracking in practice.
- Remember that figures reported before and after the 2026 SEBI domestic spot price valuation shift may reflect different underlying methodologies and are not perfectly comparable on a like-for-like basis.
Frequently Asked Questions
1. What is a “good” tracking error for a Gold ETF in India?
There is no single universal threshold, since acceptable ranges shift with market conditions and reporting methodology, but among Indian Gold ETFs, figures in the roughly 0.1% to 0.3% range are commonly reported as being on the lower, more favourable end of the category as of 2026 data. Compare funds against each other within the same reporting period and data source rather than against a fixed absolute number.
2. Is tracking error the same as expense ratio?
No, though they are related. The expense ratio is a fixed, disclosed annual fee that contributes predictably to tracking difference (the fund will lag its benchmark by roughly the expense ratio amount, all else equal). Tracking error is a broader, calculated statistical measure of day-to-day return volatility relative to the benchmark, which is influenced by the expense ratio but also by cash drag, execution timing, and other operational factors.
3. Can a Gold ETF have a negative tracking difference but still be considered a good fund?
A negative tracking difference (the fund underperforming gold) is actually the expected, normal outcome for a physically backed Gold ETF, since the fund’s expense ratio and small cash buffer both create a modest, structural drag relative to the pure benchmark. A negative tracking difference roughly in line with the fund’s expense ratio is a sign of healthy, expected fund operation, not a red flag. It is a large, unexplained, or erratic negative tracking difference that deserves scrutiny.
4. Do older tracking error comparisons from before 2026 still apply?
Not perfectly. Following the SEBI circular of 26 February 2026, which shifted Indian Gold ETF valuation from the international LBMA benchmark to direct domestic spot pricing, the underlying methodology for calculating a fund’s NAV changed. Tracking error figures calculated before this transition used a different valuation basis than figures calculated after it, so historical comparisons that span across this transition date should be interpreted with some caution.
5. Why do different websites report different tracking error numbers for the same Gold ETF?
Because tracking error depends on the specific benchmark chosen for comparison (domestic spot price versus a specific index versus international LBMA-derived reference), the specific time window measured, and the exact statistical convention used (sample versus population standard deviation, for example). This is precisely why the table in this article presents approximate, directionally indicative figures rather than a single definitive number, and why checking a fund’s own current factsheet remains the most reliable single source for a decision-relevant figure.
6. Should I switch out of a Gold ETF just because a competitor fund has a marginally lower reported tracking error?
Not automatically. A small difference in tracking error (say, 0.05 to 0.10 percentage points) compounds to a relatively modest difference in outcome over most realistic holding periods, especially compared to the impact of selling and re-entering a position, which triggers a capital gains tax event, as covered in our gold portfolio rebalancing guide. Weigh the tax cost of switching against the marginal tracking benefit before making a change.
Key Takeaways
- Tracking error is formally the annualised standard deviation of the daily return differences between a Gold ETF and its gold benchmark, a measure of the volatility of the day-to-day gap, not simply its average size.
- Tracking difference is the simpler, more intuitive metric: the plain difference between the fund’s and the benchmark’s returns over a given period, telling you how much return you gained or gave up in total.
- These two metrics are related but distinct, and a well-run fund typically shows both a low, consistent tracking error and a small, expense-ratio-sized tracking difference.
- Real 2026 data places several major Indian Gold ETFs, including UTI Gold ETF, Nippon India ETF Gold BeES, Kotak Gold ETF, SBI Gold ETF, and HDFC Gold ETF, in a broadly comparable, relatively low tracking error range, though exact rankings vary by data source and reporting period.
- An academic 10-year study found several major Indian Gold ETFs delivering returns of 11.16% to 11.36%, slightly ahead of physical gold’s 11.01% over the same period, largely due to the elimination of making charges and storage costs inherent to physical gold ownership.
- You can calculate tracking error yourself from publicly available daily NAV data using a standard spreadsheet formula: the annualised standard deviation of daily return differences.
- Figures reported before and after the 2026 SEBI domestic spot price valuation shift are not perfectly comparable, since the underlying NAV calculation methodology changed industry-wide.
Sources: Cafemutual: Meet ETFs with the Lowest Tracking Error and Tracking Difference; Cafemutual: Here Are the ETFs with Lowest Tracking Error and Tracking Difference; JETIR: Gold ETFs in India, An Empirical Study on Returns, Trends, and Tracking Efficiency, 2025-26; ClearTax: Best Gold ETFs in India 2026, Top Gold Investment Options.
This article is for general financial education only and does not constitute investment advice. Reported tracking error figures vary by data source, time period, and calculation methodology; always verify current figures from a fund’s own factsheet before making a decision. Past performance does not guarantee future returns. Consult a SEBI-registered investment advisor for personalised guidance.